Introduction:
In the dynamic and often unpredictable world of stock markets, traders and investors are constantly looking for reliable tools to understand price movements and make informed decisions. Amidst fluctuating charts and emotional decision-making chaos, one technical indicator has stood the test of time: the Relative Strength Index (RSI). But what is RSI indicator, and why has it been a staple in the toolkits of both new and experienced traders for decades?
When market volatility is high, sharp price movements can make you unsure whether to buy, sell, or hold. Without a clear framework, even experienced traders can fall prey to fear, greed, or analysis paralysis. This is where the RSI shines. The RSI is more than just a line on a chart – it is a window into market psychology. Measuring the speed and magnitude of price changes helps traders identify overbought conditions (when a stock is overvalued) and oversold zones (when it may be undervalued). Whether you are trading or investing in stocks, forex, cryptocurrencies, or commodities, the RSI provides useful insights for timing entries, spotting reversals, and confirming trends.
In this blog, we will demystify the RSI indicator, explain how it works, and explore practical strategies for applying it effectively. You will learn how to interpret its signals, avoid common pitfalls, and combine it with other tools to build a powerful trading strategy. By the end, you will not only understand the RSI indicator but also know exactly how to harness its power to make smarter, data-driven decisions in any market.
Table of Contents
What is RSI Indicator?
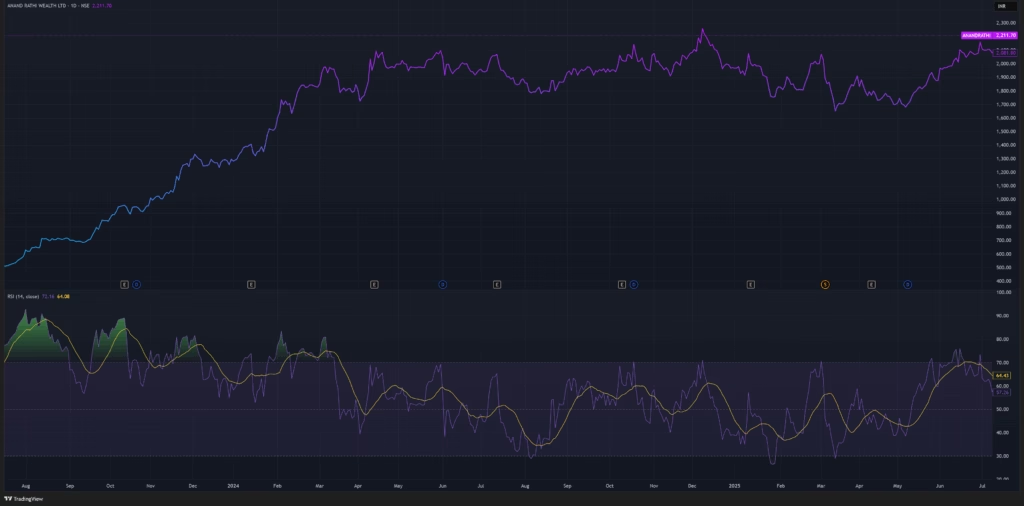
The Relative Strength Index (RSI) is a momentum oscillator widely used in technical analysis, designed to measure the speed and magnitude of stock price movements. Developed by J. Wells Wilder in 1978, it helps traders identify overbought or oversold conditions of a stock, measure the strength of a trend, and identify potential reversals.
Formula to Calculate RSI:
The formula to calculate RSI is as follows:
RSI = 100-{100/(1+RS)}
Here RS (Relative Strength) is calculated as:
RS = Average Gain Over a Certain Period/Average Loss Over the Same Period.
Generally, the certain period is 14 days.
Basic Concept of RSI Indicator:
RSI is a momentum oscillator that gives a value between 0 to 100. Its basic function is to indicate whether a stock is overvalued or undervalued.
Overbought Zone (Above 70):
If the RSI value is 70 or higher, it means that the stock is overvalued and in an overbought zone. However, it could also mean that the price is about to fall, bringing the RSI below 70.
Oversold Zone (Below 30):
If the RSI value is 30 or lower, it means that the stock is undervalued and in an oversold zone. This could mean that the price is about to rise or the opposite is happening.
How to Use the RSI Indicator:
Divergence:
RSI is a strong indicator that indicates potential reversal movement:
Bullish Divergence:
When the price of a stock is falling and the RSI is rising, it could mean that the price is about to reverse and the price will start to rise.
Bearish Divergence:
On the other hand, when the price of a stock is rising and the RSI is falling, it could mean that the price is about to reverse and the price will start to fall.
Trend Confirmation:
By using the RSI indicator, traders try to understand the trend of a stock, i.e. whether it’s in an uptrend or downtrend.
Above 50:
If the RSI of a stock remains consistently above 50, it may indicate that the stock is in an uptrend.
Below 50:
If the RSI of a stock remains consistently below 50, it may indicate that the stock is in a downtrend.
Failure Swings:
Bearish Failure Swing:
If the RSI rises above 70 (overbought), drops below 70, and then rallies again and remains below 70, the signal is a sell opportunity.
Bullish Failure Swing:
If the RSI drops below 30 (oversold), rises above 30, and then dips again and remains above 30, the signal is a buy opportunity.
Limitations and Challenges of Using RSI Indicator:
RSI is one of the most powerful trading indicators, but it also has some limitations and challenges that traders should keep in mind. It should be used along with other indicators.
False Signal:
Sometimes RSI gives the false signal, i.e. the price continues to trend even after it is in overbought or oversold territory.
Example, if the RSI falls below 30, then technically it is an oversold signal and the price may reverse. But if the market is in a strong downtrend, the price will continue to decline even after the RSI is oversold.
Sometimes Fail to Work in Trending Market:
RSI works relatively well in range-bound markets but may fail in strong trending markets.
If a stock is in a strong uptrend, the RSI will repeatedly be in the above 70 zone and show overbought conditions. But this does not always mean that the price will fall. It is only an indication of strong momentum.
Ignores Sudden Trend Change:
RSI is calculated based on the last few candles (usually 14 days), which is why RSI cannot accurately capture sudden news or major events in the market.
If a company releases quarterly results or some bad news, the price may suddenly drop or rise. RSI will reflect this movement with a delay.
Divergence Does Not Always Work:
Divergence is the difference between RSI and price that gives an important reversal signal, but it doesn’t always work.
If the price of a stock is falling, but the RSI is rising (bullish divergence), then theoretically the price should increase. But if there is a strong bearish sentiment in the market, the price may decrease further.
Conclusion:
In conclusion, it can be said that the Relative Strength Index (RSI) is a cornerstone of technical analysis, providing traders with a perspective for interpreting market momentum and potential turning points. As we’ve explored in this blog, understanding what the RSI indicator is – a momentum oscillator that measures the speed and magnitude of price movement – can help identify overbought and oversold conditions, identify divergences, and validate trends. However, its real power lies not in isolation but in how it integrates into a disciplined, well-rounded trading strategy.
The RSI is not a crystal ball, but a compass. It won’t predict the future, yet it equips you to navigate uncertainty with greater clarity. By respecting its limitations, leveraging its strengths, and committing to lifelong learning, you’ll transform the RSI from a simple line on a chart into a strategic ally. Also, it must be kept in mind that RSI should be used along with other indicators, like MACD, Volume, Supertrend, Bollinger bands, etc. to get a better result.