Introduction:
The volume indicator is a fundamental yet often underestimated element in stock market analysis, serving as the driving force behind price action. While price action reveals what is happening in the market, volume explains how and why these movements occur, showing whether trends are supported by strong participation or driven by weak momentum. The volume indicator enables traders to decode market sentiment, verify trend strength, and identify early reversal signals like divergence. This blog examines the concept of volume, its application in technical analysis, and effective strategies for leveraging its insights, including confirming breakouts, identifying accumulation and distribution phases, and avoiding false signals. By combining volume data with price action and other tools, traders can equip themselves to make informed decisions.
Table of Contents
What is the Volume Indicator?
A volume indicator is a technical analysis tool that measures the number of shares or contracts (e.g., stocks, futures, Exchange-Traded Funds) traded within a given period of time. It acts as a pulse check for market activity, reflecting the intensity of buying or selling pressure. High volume indicates strong confidence among traders, while low volume indicates indecision. For example, a stock that is rising on high volume is more likely to sustain its rally than one that is rising due to low participation.
How Volume Indicators Work:
Every transaction, whether a buy or sell, increases the volume count. For example, if 1,000 shares of Company Z are traded in a day, the daily volume would be 1,000. Volume is displayed as a histogram below the price chart, with long bars indicating high activity, meaning there is more volume. Analysts use this information to measure liquidity; high-volume stocks are easy to trade without significantly affecting the price.
Key Components of Volume Analysis:
There are two key components of volume analysis, which are as follows:
Raw Volume Data:
This data represents the number of shares traded in a specific timeframe (i.e. hourly, daily). It is displayed below the stock price chart, with taller bars indicating higher trading activity.
Volume Indicators:
Mathematical formulas are applied to the raw volume data to identify the patterns, trends, and divergences. Example includes On-Balance Volume (OBV), Chaikin Money Flow, and the Volume Oscillator.
Key Volume Indicators:
Key volume indicators are as follows:
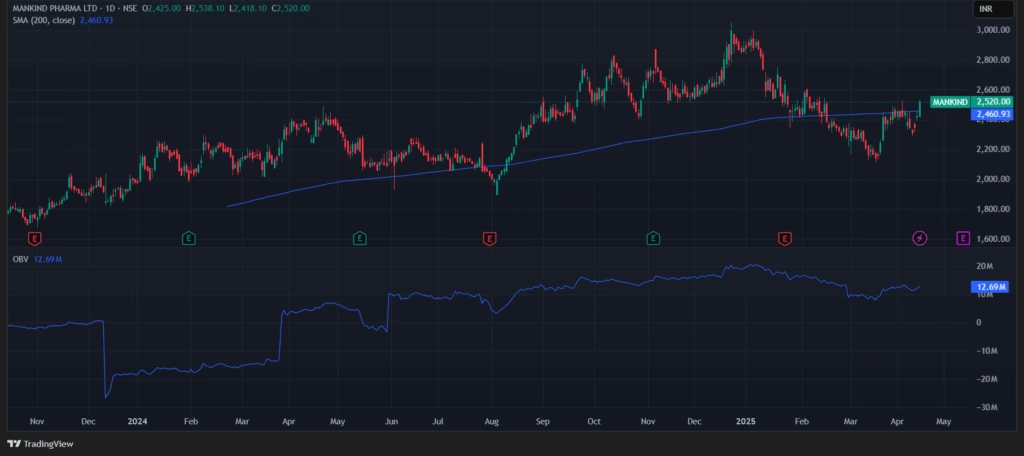
On-Balance Volume (OBV):
Adds volume when the price closes higher and subtracts volume when the price closes lower. It confirms the trend. A rising OBV indicates accumulation (buying pressure), while a falling OBV indicates distribution (selling pressure).
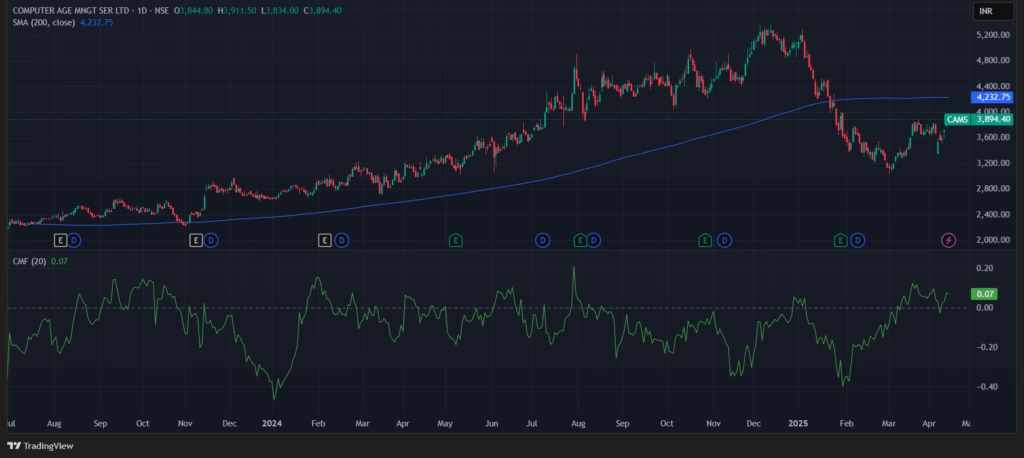
Chaikin Money Flow (CMF):
Combines price action and volume over a 20–21-day period, measuring buying/selling pressure. A value of CMF above zero indicates bullish sentiment (accumulation); below zero, bearish (distribution). This highlights institutional activity.
Volume-Weighted Average Price (VWAP):
Calculates the average price by volume over a trading session. Used in intraday trading to determine fair value. Prices above the VWAP indicate bullish sentiment, while those below indicate bearish sentiment.
Volume Oscillator:
Compares short-term (e.g., 5-day) and long-term (e.g., 10-day) volume moving averages. It detects momentum changes. A positive value signals an increase in volume momentum, often before a price breakout.
Money Flow Index (MFI):
Similar to the Relative Strength Index (RSI), an oscillator (0-100) combines price and volume to measure overbought/oversold conditions.
Interpreting Volume Indicator: Confirmation and Divergence
Understanding how volume interacts with price is crucial in technical analysis. When combined with price analysis, volume can help traders confirm trends or identify potential reversals through patterns known as confirmations and divergences. Here is a detailed breakdown:
Volume Confirmation:
Volume confirmation occurs when volume supports the trending price action. Essentially, when volume behaves in a way that is consistent with the price action, it adds credibility to the trend.
Explanation:
Price Rise with Increasing Volume:
When the price is moving up along with volume, it indicates that more market participants are involved in the move, indicating a strong uptrend. This participation means that the move is more likely to be sustainable.
Price Fall with Decreasing Volume:
When price and volume are trending down, it can sometimes indicate that selling pressure is weakening, which could indicate that a reversal or stabilization may be on the horizon.
Example:
Imagine a stock in an uptrend that breaks above resistance on notably high volume after a period of consolidation. This significant volume reinforces the breakout, suggesting that the uptrend has genuine support and is likely to continue or be a genuine breakout.
Volume Divergence:
Volume divergence occurs when the volume trend goes in the opposite direction of the price trend. This misalignment may indicate that the existing price trend may be weakening or reversing.
Types of Divergence:
Bullish Divergence:
When stock price makes a lower low, but volume does not increase or decrease accordingly. This divergence may indicate that despite the low price level, buyers have started to join in. This could signal a potential downtrend or an impending bullish reversal, as more investors are picking up shares at lower prices.
Bearish Divergence:
When stock price reaches new highs, but volume does not increase proportionately or begins to decline. This situation indicates that the rally may be coming to an end. The decrease in volume is due to fewer market participants pushing prices higher. This can be an early warning that a reversal or pullback is imminent.
Limitations of Volume Indicator:
While volume indicators are potent tools in technical analysis, they are not infallible. Understanding their limitations helps traders to refine their strategies:
Lagging Nature:
Volume data reflects past activity rather than future price movements. It confirms trends or reversals after they occur but does not predict them.
Example: A surge in volume during a sell-off confirms panic selling but does not indicate whether the downtrend will persist.
Market Noise and Distortion:
Trades like High-Frequency Trading (HFT), algorithmic bots, or block trades can cause artificial volume spikes that misrepresent real market sentiment.
Example: Sudden volume spikes resulting from HFT arbitrage may not accurately reflect organic buying or selling pressure.
Lack of Directional Clarity:
Volume indicators reflect activity, not intent. High volume alone does not reveal whether buyers or sellers are dominating.
Example: A stock rising on high volume may indicate institutional accumulation or short covering, which requires additional context.
Market Inconsistency:
The reliability of volume varies significantly across different asset classes and liquidity levels. In the stock market, volume is generally transparent and reliable, providing accurate information for analysis. However, in decentralized markets such as forex and cryptocurrencies, the absence of centralized volume data can lead to less accurate information that can lead to incorrect decisions. In addition, stocks with low liquidity can present misleading volume patterns due to their weak trading, which makes it more difficult to assess market behaviour.
Dependency on Context:
Interpreting volume growth or decline often necessitates a qualitative context (e.g., earnings reports, geopolitical events, etc.).
Example: Earnings growth during a period of increasing earnings may suggest a short-term boom rather than a sustainable trend.
Risks of Manipulation:
In markets where stocks are not that much liquid, large players can manipulate volume to trap retail traders (e.g., “pump-and-dump” schemes).
False Signals:
Volume divergence or confirmation can sometimes create false signals, especially in volatile or sideways markets.
Example: A bullish divergence (low price and decreasing volume) cannot reverse if the broader market sentiment turns bearish.
Overdependence on Volume Indicator:
Relying on volume alone ignores important factors such as fundamentals, market structure, or macro trends, and can sometimes lead to uninformative decisions.
Example: A stock in a downtrend may show increasing volume (bearish confirmation), but a strong earnings report may reverse the trend.
Mitigating the Limitations of Volume Indicator:
To address the shortcomings of volume indicators, traders can adopt these strategic approaches, enhancing accuracy and reducing risks:
Combine with Other Tools:
Using volume indicators with other tools can fill in the lack of direction and other lags. Confirm signals with price action (e.g., a high-volume breakout above resistance reinforces a bullish trend). Momentum oscillators like RSI filter out noise (e.g., volume spikes during sell-buy signals over RSI < 30). Volume trends can be matched with moving averages (e.g., rising volume during a 50-day/200-day MA bullish crossover validates long-term momentum). Volume cross-checking with these tools eliminates false signals and enhances accuracy.
Trade High-Liquidity Assets:
Volume data in illiquid markets (e.g., penny stocks) is prone to distortion or manipulation due to low trading activity, so prioritize assets with high average daily volumes, major forex pairs, or ETFs -where volume patterns reflect genuine market participation. Avoid thinly traded stocks, where a single large order can artificially inflate volume, creating misleading spikes (e.g., a micro-cap stock with erratic 100K volume). This ensures volume signals stem from organic market activity, not anomalies.
Avoid Overfitting:
Over-reliance on volume indicators may work in hindsight but fail in the live market. Use the volume indicator as a secondary tool for confirmation, i.e., use it to validate signals derived from price action, macroeconomic factors, or fundamental analysis. For example, instead of buying solely because OBV is rising, wait for a bullish candlestick pattern (e.g., hammer) or positive earnings growth.
Conclusion:
Volume indicators are essential allies in a trader’s toolkit, providing a window into the why behind price movements. By quantifying market participation, they reveal the persistence or lack thereof of trends, breakouts, and reversals. Tools like OBV, Chaikin Money Flow, and VWAP enable traders to distinguish sustainable trends from fleeting noise, while divergences serve as early warning systems for potential shifts in sentiment.
However, volume is not a crystal ball. Its limitations – lagging behind data, context dependency, and sensitivity to manipulation – demand a disciplined, multi-faceted approach. Successful traders combine volume indicators with price action, other technical indicators, and fundamental context, ensuring that signals are valid on multiple levels. From confirming breakouts with increasing volume to identifying exhaustion through bullish divergence, the key lies in balance and adaptability.
Ultimately, it can be said that volume is the storyteller of market psychology. By listening to its narrative – in tune with the larger market dynamics – traders can tackle uncertainty with more clarity, turning raw data into actionable insights. In the chaos of charts and headlines, let volume be your compass, not your crutch.