Introduction:
If you think that stock trading is like a puzzle, then it can be said that the Moving Average Convergence Divergence (MACD) indicator is the missing piece that you need to solve it. Whether you are a curious beginner or someone who has taken a few steps forward in the world of stock trading, understanding the MACD indicator can be a game-changer for your stock trading journey.
Through this blog, we will discuss in detail what the MACD indicator is, how it works, and how you can use it effectively to make informed trading decisions. After reading this blog, you will have a clear understanding of the MACD indicator and be able to interpret stock charts and identify market trends.
Table of Contents
What is the MACD Indicator?
The MACD indicator is one of the most widely used and famous technical indicators in the stock market. It was developed in 1970 by Gerald Appel. The MACD indicator helps a trader identify changes in the strength, momentum, direction, and duration of a stock’s price trend.
The MACD indicator is a trend-following momentum oscillator – but don’t let that phrase scare you. Once you understand the components of this indicator, you’ll see that it’s actually quite simple.
Components of the MACD Indicator:
The MACD indicator basically consists of 3 main parts:
MACD Line:
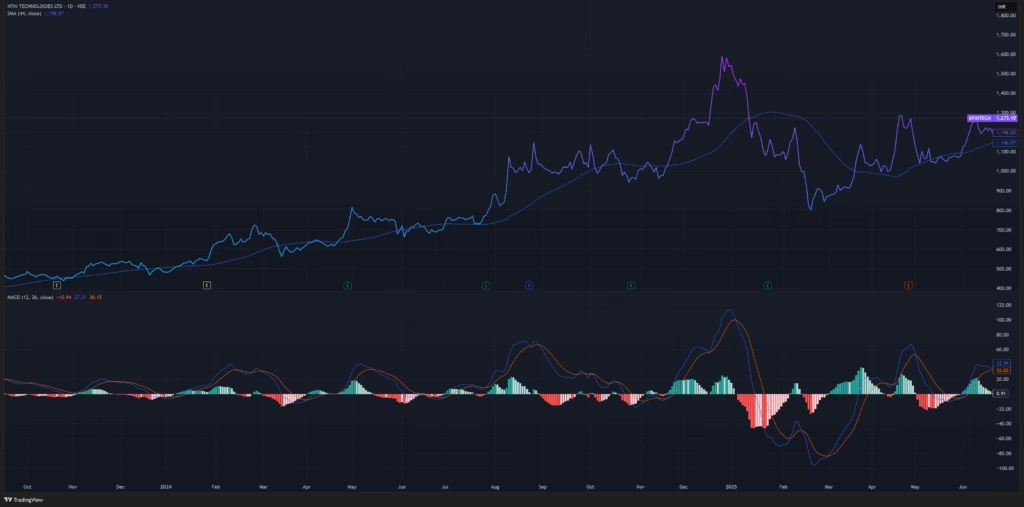
The MACD line is the difference between the 12-day and 26-day Exponential Moving Averages (EMAs) of a stock’s closing price.
Signal Line:
The 9-day EMA of the MACD line is called the signal line, which acts as a trigger for a buy or sell signal.
Histogram:
The histogram is a bar chart that represents the difference between the MACD line and the signal line. It shows momentum, whether increasing or decreasing.

How Does the MACD Indicator Work?
Imagine you’re surfing on a beach; the MACD indicator will point you to the right wave, i.e., it helps you spot which wave you should ride (buy) and which wave you should ride off (sell).
The MACD Line Crosses the Signal Line:
Bullish Signal (Buy):
When the MACD line crosses above the signal line, it may indicate that the price of that stock is gaining upward momentum.
Bearish Signal (Sell):
When the MACD line crosses below the signal line, it may indicate a loss of momentum or a downtrend.
MACD Histogram:
- Growing bars in the histogram indicate increasing momentum.
- Shrinking bars in the histogram indicate slowing momentum.
- When the histogram reverses from positive to negative or from negative to positive, it indicates a trend reversal.
Zero Line Crossover:
When the MACD line crosses the zero line from below upwards, it is considered a bullish sign, and on the other hand, when it crosses from above downwards, it is considered a bearish sign.
Why Use the MACD Indicator?
Knowing what the MACD indicator is and how it works, you may naturally wonder why so many traders and analysts use it. Here are some reasons why:
Trend Detection:
This indicator helps you identify trends or consolidations in a stock.
Momentum Insight:
The MACD indicator provides a basic indication of rising or falling momentum.
Versatility:
The MACD indicator is known for its versatility. It works across stocks, ETFs, indices, cryptocurrencies, and even commodities.
User-Friendly:
The MACD indicator is simple yet powerful compared to the more complex tools used in trading.
Advantages of Using the MACD Indicator:
The advantages of using the MACD indicator are as follows:
Combines Trend and Momentum:
One of the greatest strengths of the MACD indicator is its ability to reveal both the direction of a trend and the momentum behind it. Most technical indicators focus on one direction, but this indicator combines short-term (9-day) and long-term (26-day) EMAs to show in which direction and how fast the price is changing. This dual-purpose insight makes this technical indicator very powerful for traders who want to time their entries and exits more effectively.
Easy to Use and Understand:
Despite being a technical indicator, it is beginner-friendly. It clearly provides some visual signals such as:
- When the MACD line crosses the signal line, it indicates a change in momentum. If the MACD line crosses the signal line from bottom to top, the stock is gaining momentum, and if it crosses from top to bottom, the stock is losing momentum.
- The growth and contraction of the histogram bars help in measuring the strength of momentum.
Even someone who is new to the world of trading can easily recognize these simple patterns without any charting skills.
Effective in Trending Market:
The MACD indicator is most effective in strong trending situations. Whether bullish or bearish, this indicator helps traders stay with the trend of a stock for as long as possible. The crossover and histogram indicate initial entry and exit points, while the behaviour of the indicator helps identify when the trend is weakening or reversing.
Customizable Settings:
The default MACD indicator uses 12-day and 26-day EMAs, and also has a 9-day signal line. But the advantage of this indicator is that traders can change its settings to suit their trading style.
Reliable Divergence Indicator:
The MACD indicator is known for its ability to detect divergence. When a stock’s price moves in one direction and the MACD moves in the other, it is often a leading signal that a trend reversal may be imminent.
Works Across Assets:
The MACD indicator is versatile; it is not limited to just one market. It can be applied to stocks, ETFs, commodities, and even currencies. This universal application has made this indicator popular with many traders, regardless of the asset they analyse.
Limitations of the MACD Indicator:
Lagging Indicator:
The MACD indicator is lagging. It is calculated using a 9-day and a 26-day exponential moving average (EMA), making it inherently a lagging indicator. This means that MACD signals appear after the price trend has begun. For example, when a bullish crossover occurs, the stock has already moved higher, which can cause traders to enter late and miss the most profitable part of the move.
False Signal in Sideways Market:
The MACD indicator works very well in trending markets, but it becomes unreliable when the market is sideways or volatile. When the market is fluctuating within a narrow range (sideways), the MACD line repeatedly crosses the signal line, leading to false signals and incorrect trading decisions.
No Overbought/ Oversold Zones:
Unlike the Relative Strength Index (RSI) and the Stochastic Oscillator, the MACD indicator does not have any overbought and oversold zones. It does not detect when an asset is too expensive or too cheap. As a result, it is not ideal for mean-reversal strategies, where traders bet on prices moving back towards their mean.
Best Used with Other Tools:
The MACD indicator is powerful, but trading based on it alone can be risky. Therefore, it is best used in conjunction with other indicators such as RSI, Bollinger Bands, Supertrend, or volume analysis.
Less Effective for Quick Scalping:
Scalping involves very short-term trading that lasts a few minutes or sometimes a few seconds. Since the MACD indicator is based on moving averages, it responds to price changes much more slowly than ultra-fast indicators. Therefore, it is more effective for swing trading or positional trading.
Conclusion:
The MACD indicator is more than just a line or a histogram. It is a proven technical indicator that helps traders identify momentum, trend strength, and potential reversals. Whether you are new to the world of trading or an experienced trader, knowing how to read MACD signals can give you a significant edge.
From identifying bullish and bearish crossovers to spotting hidden divergences, the MACD indicator gives you the power to time your entries and exits. Its simplicity, coupled with the depth of information it provides, makes it a must-have in every trader’s toolkit.
No indicator is perfect, and the MACD indicator is no exception. This indicator works well in trending markets, but it can give false signals in sideways or volatile markets. Therefore, it is best to use it in conjunction with other technical indicators such as RSI, price action, and Supertrend.
In conclusion, it can be said that the MACD indicator is a reliable and versatile companion on your stock market journey. Learn it well, practice it patiently, and it can become one of your strongest indicators in determining market trends.


