The stock market is a place where it is important to explore and analyze as well as make money. If you are a beginner, understanding some of the basic stock market indicators will help you make informed investment decisions. Indicators will help you understand the market trends, stock performance, and overall economic conditions. Let’s discuss the 10 most important stock market indicators:
Table of Contents
Price to Earnings Ratio (P/E Ratio):
The P/E ratio is a stock valuation metric. It measures how much investors are willing to pay for a company’s ₹1 of earnings. It is the ratio of the market price of a share to the Earnings Per Share (EPS), which tells you whether a stock is overvalued or undervalued.
Formula:
P/E Ratio = Market Price Per Share / Earnings Per Share (EPS).
Example:
Suppose, a company’s current stock price is 1000, and its EPS is 100. Then the P/E ratio is
P/E Ratio = 1000/100 = 10
How to interpret the P/E ratio?
High P/E Ratio:
If a stock’s P/E ratio is higher than the industry average, it may be overvalued.
Low P/E ratio:
A low P/E means that the stock may be undervalued.
Benefits of P/E Ratio:
Quick Comparison:
It helps to compare the prices of different stocks, especially if they are in the same industry.
Determine the Valuation:
The P/E ratio helps to understand whether a stock is overvalued or undervalued.
The P/E ratio is a powerful stock market indicator that provides insight into a stock’s valuation. Still, it should not be used alone. Always combine the analysis with other indicators such as Earnings Per Share (EPS), debt-to-equity ratio, relative strength index, and industry trends.
Moving Average:
Another important stock market indicator is the Moving Average (MA). A moving average (MA) is a tool that calculates the average of a stock’s past prices over a specified period of time. Its purpose is to smooth out the stock’s price trend, removing the noise of short-term price fluctuations.
Formula:
Moving Average (MA) = Sum of prices over N days / N
Example:
Suppose, the closing price of a stock for 5 days is ₹100, ₹102, ₹104, ₹106, ₹108,
The MA is = (100+102+104+106+108)/5 = ₹104.
Types of Moving Average:
There are two types of moving average:
Simple Moving Average (SMA):
The SMA is a simple average of a stock’s price over a specified period. For example, if you were to plot a 10-day SMA, you would calculate the average of the closing prices of the previous 10 days.
Exponential Moving Average (EMA):
he EMA is a bit more advanced. It gives more weight to recent prices so that it better reflects the current market trend.
Practical Uses of Moving Average:
Trend Identification:
If a stock’s current price is above the moving average, it indicates a bullish trend (the price is likely to increase). On the contrary, if the price is below the moving average, it indicates a bearish trend (the price is likely to decrease).
Find Resistance and Support:
Moving averages often act as support (where the price stops falling) or resistance (where the price stops rising).
Example: If a stock is near the 200-day SMA, it can be a support level.
Crossover Strategy:
Golden Cross:
When the short-term moving average (e.g., 50-day) crosses above the long-term moving average (e.g., 200-day), it is a strong bullish signal.
Death Cross:
When the short-term moving average crosses below the long-term moving average, it is a bearish signal.
Relative Strength Index (RSI):
RSI (Relative Strength Index) is one of the most popular technical stock market indicators in the world of stock trading. It measures a stock’s momentum and indicates whether it is overbought or oversold, giving investors and traders a buy or sell signal. Its scale ranges from 0 to 100.
Formula:
The formula to calculate RSI is as follows:
RSI = 100-{100/(1+RS)}
Here, RS represents Relative Strength:
RS = Average Gain Over a Certain Period/Average Loss Over the Same Period.
How to Interpret RSI?
Above 70 (Overbought):
An RSI value of 70 or higher means that the stock price has recently increased significantly and may be in overbought territory. This is a signal that the price may fall.
Below 30 (Oversold):
An RSI value of 30 or less means that the stock price has fallen significantly recently and may be in oversold territory. This signals that the price may rise.
Debt-to-Equity Ratio:
One of the important stock market indicators is the debt-to-equity ratio. It shows the balance between a company’s debt and equity.
Formula:
Debt-to-Equity Ratio = Total liabilities (debt)/Total shareholders’ equity.
It provides an idea about a company’s financing structure, i.e., how much debt and equity the company uses to run its daily business.
How to Analyze Debt-to-Equity Ratio?
A ratio of less than 1 (low debt):
A ratio of less than 1 means that the company has low debt and is operating the business smoothly with equity. Here, the financial risk for investors is low.
A ratio of more than 1 (high debt):
A ratio of more than 1 means that the company has a high debt load, which can be risky. A ratio of more than 1 is not always risky for investors because if the company uses its debt efficiently and grows, then a higher ratio can be acceptable.
Example:
Let’s understand with an example
Company A:
Total Debt = ₹500 Crore
Total Equity = ₹1000 Crore
Debt-to-Equity Ratio = 500/1000 = 0.5
The debt-to-equity ratio of company A is less than 1, i.e. 0.5. It is a good company to invest in.
Company B:
Total Debt = ₹2000 Crore
Total Equity = ₹1000 Crore
Debt-to-Equity Ratio = 2000/1000 = 2.0
The debt-to-equity ratio of company B is more than 1, i.e. 2. It may be a risky company to invest in.
Importance of Debt-to-Equity Ratio:
Indicator of the financial health of the company:
A company with a high debt-to-equity ratio means that it is dependent on debt to run its operations.
Risk Assessment:
High Debt-to-Equity Ratio:
A company with a high debt-to-equity ratio has a high debt burden, which increases investment risk. It may be difficult to repay debt if profits decline.
Low Debt-to-Equity Ratio:
The company is stable and debt repayment is easy.
Earnings Per Share (EPS):
Another important stock market indicator that measures a company’s profitability is Earnings Per Share (EPS). It tells how much earnings the company is generating for each share you own. As an investor, EPS is an important stock market indicator because it shows you how much your shares are contributing to the company’s profits.
Formula:
EPS = (Net Profit After Tax – Preferred Dividends)/Total No. of Outstanding Shares
Net Profit After Tax: Total profit of the company after deducting tax.
Preferred Dividends: If the company has any preferred shareholder, then their dividend is subtracted from the total profit after paying tax in calculating the EPS.
Total No. of Outstanding Shares: Number of company’s shares circulating in the market.
How to Interpret EPS?
High EPS:
High EPS indicates that the company is profitable, i.e., the company is efficiently generating profits and creating value for shareholders.
Low EPS:
Low EPS indicates either the company is making less profit, or that it has more shares outstanding.
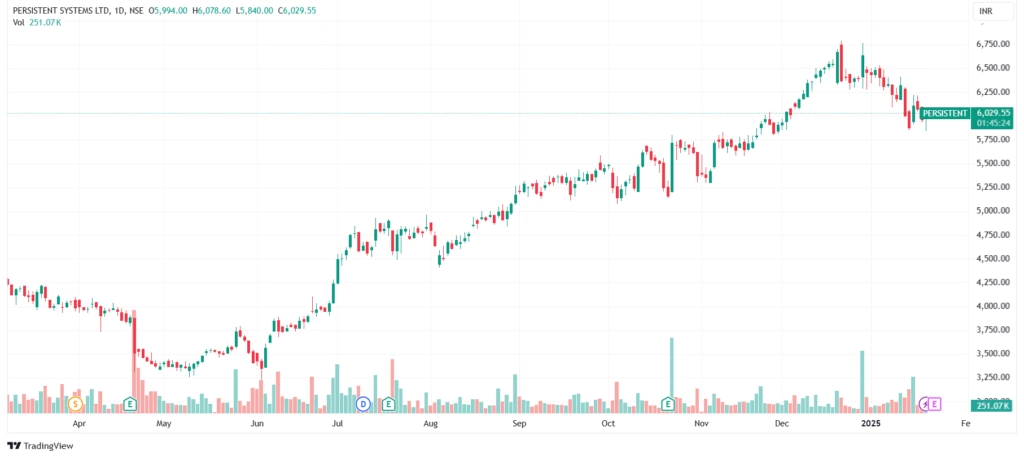
Volume:
In the stock market, “volume” refers to the amount of buying and selling of a particular stock over a given period (such as one day). It is a technical indicator that tells you how actively a stock is being traded. Volume data makes it easy to understand how much interest there is in a stock and how strong its trend is.
Interpretation of Volume:
High Volume:
When the trading volume of a stock is high, it means that investors are more interested in that stock.
Example: If the price and volume of a stock are rising together, then it is a positive signal that more people are supporting the stock’s trend.
Low Volume:
When the trading volume of a stock is low, it means that investors are less interested in that stock.
Example: If the price and volume of a stock are falling together, then it is a negative signal that more people are not supporting the stock’s trend.
Analyzing Trends with Volume:
Breakout Confirmation:
When a stock price breaks an important level (breakout), it becomes important to look at the volume.
High-Volume Breakout:
If the breakout is accompanied by high volume, it could mean that it is real.
Low Volume Breakout:
If the breakout is accompanied by low volume, it could be false.
Volume and Price Divergence:
When a stock’s price and volume move in completely opposite directions, it could signal a trend reversal.
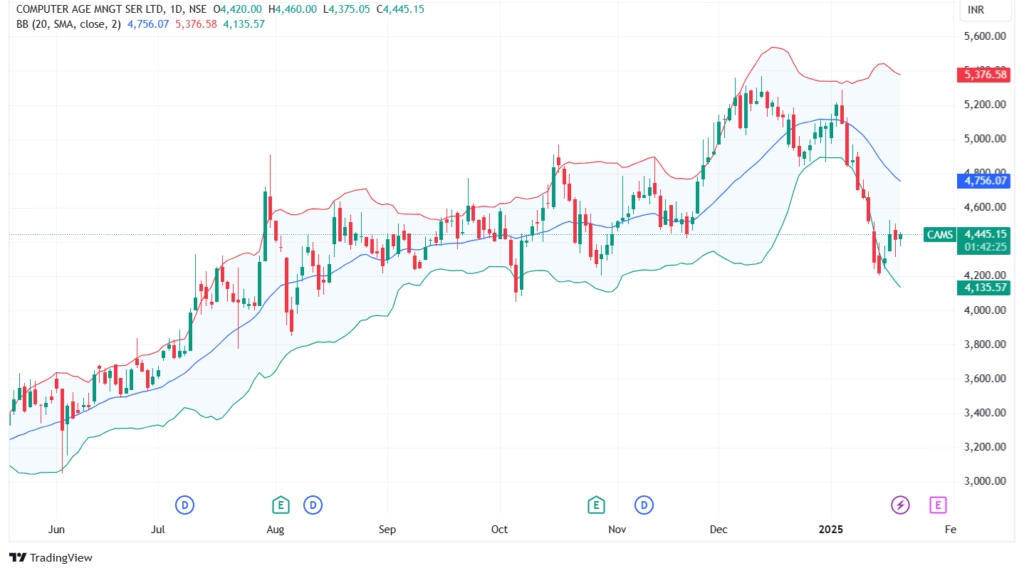
Bollinger Bands (BB):
Bollinger Bands are a popular technical stock market indicator. These bands measure the volatility of a stock’s price. These bands are divided into three parts:
Upper Band:
Upper Band = Simple Moving Average (SMA) + (2 × Standard Deviation).
It shows the highest range of prices.
Middle Band:
This denotes the average price of the stock over a certain period of time. Usually, the 20-day SMA is used.
Lower Band:
Lower Band = SMA – (2 × Standard Deviation).
It shows the lowest range of prices.
Example:
Suppose the Current Market Price (CMP) of a stock is ₹1000 and BBs are something like this:
Upper band- ₹1050
Middle band- ₹980
Lower band- ₹950
If the price is close to ₹1050, then it may be entering the overbought zone.
If the price is close to ₹950, then it may be entering the oversold zone.
If the bands are getting squeezed, then the market is calm and a big trend is likely.
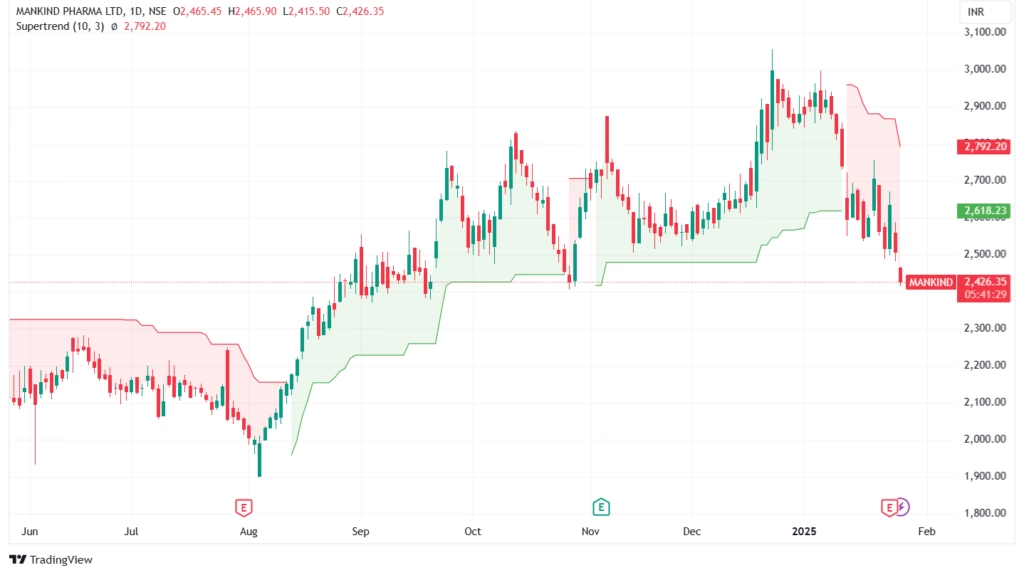
Supertrend:
Supertrend is a popular and simple technical indicator that follows the price trend and generates buy and sell signals. This indicator is very useful for short-term and intraday trading (the trading time frame is one day).
Bullish Trend:
When the stock price is above the Supertrend line, it signals a bullish trend (Buy signal).
Bearish Trend:
When the stock price is below the Supertrend line, it signals a bearish trend (Sell signal).
How Supertrend is Calculated?
The supertrend is calculated using two components:
Average True Range (ATR): Average True Range (ATR) measures market volatility.
Multiplier: A user-defined value that adjusts the sensitivity of the indicator.
The formula of the supertrend is:
Uptrend Line = (High + Low) / 2 + (Multiplier × ATR)
Downtrend Line = (High + Low) / 2 – (Multiplier × ATR)
How to Interpret Supertrend?
Entry Signal (Buy):
When the price closes above the Supertrend line, the line changes from above the price to below it. This crossover generates a Buy signal.
Exit Signal (Sell):
When the price closes below the Supertrend line, the line shifts from below the price to above it. This crossover generates a Sell signal.
Also, do not use this indicator alone, it is better to use it along with other indicators such as RSI, Moving Average, and then make buy and sell decisions.
Moving Average Convergence Divergence (MACD):
MACD is a trend-following and momentum stock market indicator, which is the difference between two moving averages. This indicator helps traders understand the momentum and direction of the price.
It consists of three components:
MACD Line: The difference between the 26-day EMA (Exponential Moving Average) and the 12-day EMA.
Signal Line: It is a 9-day EMA of the MACD line.
Histogram: The difference between the MACD and the signal line.
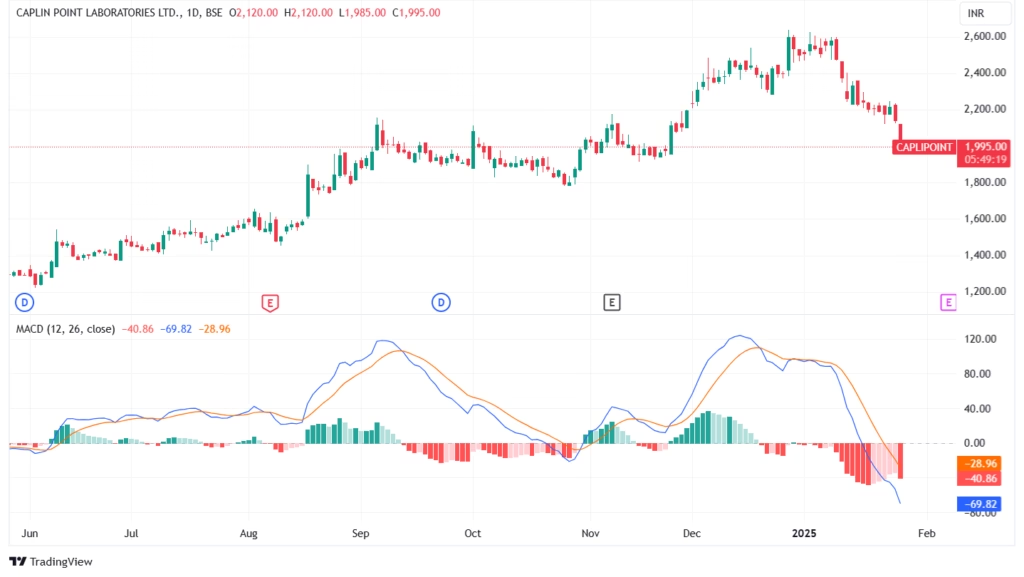
Interpretation of MACD:
When the MACD line crosses the signal line from below, it indicates a bullish trend (buy signal).
When the MACD line crosses the signal line from above, it indicates a bearish trend (sell signal).
Fibonacci Retracement:
Fibonacci retracement is a stock market indicator that identifies support and resistance levels. This indicator tells investors and traders where prices may retrace or stop during a trend. The Fibonacci sequence is a mathematical series that is used in nature, architecture, and now in the stock market.
Fibonacci Levels:
The primary levels of Fibonacci retracement are: 23.6%, 38.2%, 50%, 61.8%, and 100%, which mark important support and resistance zones during price retracements.
How Does it Work?
Identify the High and Low Points in the Price Chart:
Identify the high and low prices of a stock within a given time frame.
Draw Retracement Levels:
After that, place the Fibonacci retracement tool between the high and low points. These levels will indicate how far the price can retrace while continuing its previous trend.
Conclusion:
The stock market indicators act as the roadmap for investors and traders. However, relying only on the indicators can be wrong. Every indicator has its own limitations, so it must be used as a part of a framework. along with using these indicators, one must consider that fundamental analysis (such as company financials, management, and market position) and risk management (using stop-loss, and position-sizing) are equally important.
Another thing is that the market is dynamic, so in addition to these indicators, you need to adapt yourself to the current market situation.